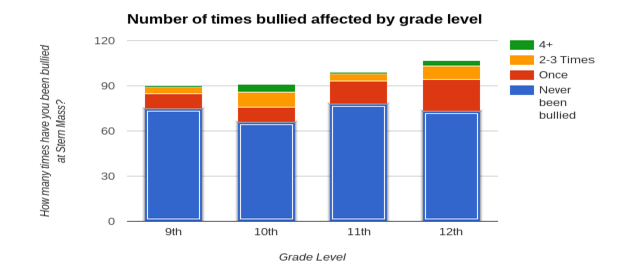
Write how not only did we want to see the comparison about the first two but also with the grade level and how many times they have been bullied here at school? In the illustrations above we see that they demonstrates not only the comparison between their GPA and the amount of times that each person has been bullied but to connect it together we also compared it their grade level. Overall we see that most students in each grade between 10th- 12th have never been bullied. This shows that in the graph above and the one below do connect since they show the same data. The next highest amount is when students are bullied “once” and the grade level where it happened the most is with the students in the 12th grade. Students that were bullied 2-3 times are the highest in the grade levels 10th and 12th grades. Students that were bullied more than 4 times is a slim to none times in some grades. As we can see most student in Stern MASS have never been bullied no matter the grade level, which is a good thing since it shows that over Stern MASS overall is a safe school. : Neocities.
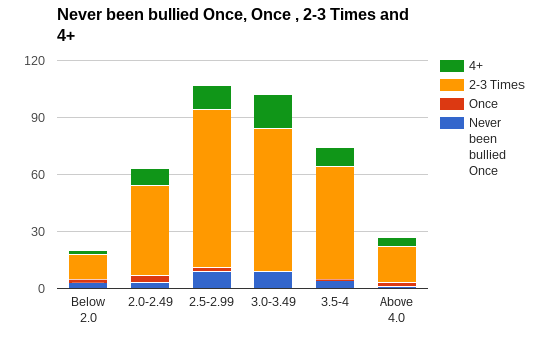
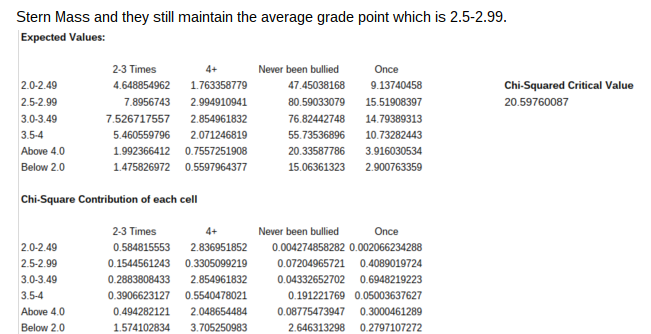
The two questions that we would like to compare their results is the question that asks about your GPA and the questions about how many times that they have bullied at Stern Mass. My group believes that there maybe a big impact on those that have been bullied the most to maybe have the higher and lower GPA’’s maybe to be the ones that are to be suffering the most of bullying and is the reason that their GPA is the way it is. Students who are dealing with bullying will perform poorly in school, because they are distracted or they just don't care. Results: Our results do not prove our hypothesis, student's grade point average is not affected due to bullying. The data proves this, in the data it shows that 80% of students are not bullied in Stern Mass and they still maintain the average grade point which is 2.5-2.99.